When it comes to web applications, the most important parameter for a good user experience is the performance of the application. You would not want to lose a customer because your website was slow to respond or open a certain request from the user, or your software just crashed because it couldn’t handle any more load!
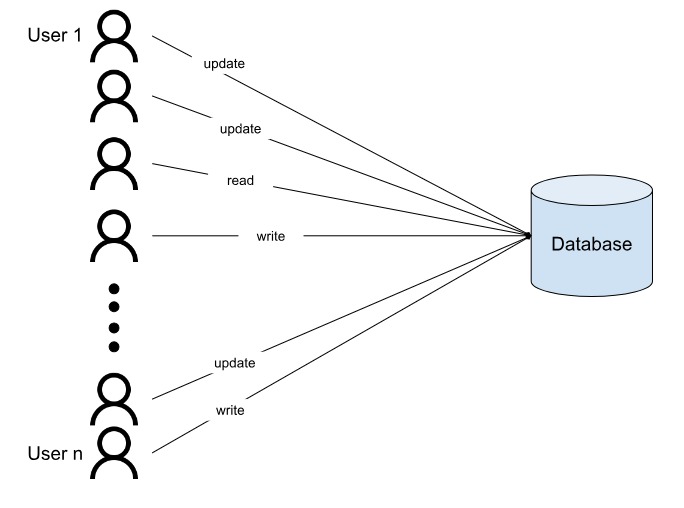
More often than not, if the database is not performant, it directly impacts the application performance. Consider a simple workflow of a new user registration. The user creates a form on the UI and the data is then stored in objects and passed on to the business layer. The business layer validates and then passes the data to be stored in the database. Imagine having 100 user registrations per hour on a web portal - that would mean 100 writes to the database in one hour! A poorly modeled database might not be able to handle the load, resulting in poor user experience in terms of registration failure, more waiting time or loss of data. A real world database would also be processing many other requests, like updates, reads or deletes, simultaneously.
To fetch particular data, the data might undergo multiple transformations, like filtering, sorting, aggregations and so on. If the database is huge, it might take some time before the database scans through to find the right data and send it back to the server.

Database performance issues could be due to poor data modeling, inefficient queries, or even improper connection pooling.
Although distributed databases, like MongoDB, are known for their scalability and performance, database administrators need to regularly monitor the performance of databases, to make sure everything is running smoothly, and identify and resolve performance issues, if any.
In this article, let us explore some of the metrics provided by MongoDB to monitor database performance.
Core metrics
The most common way that every developer knows to optimize database queries is to add indexes to the collections. MongoDB provides rich indexes to suit different requirements.
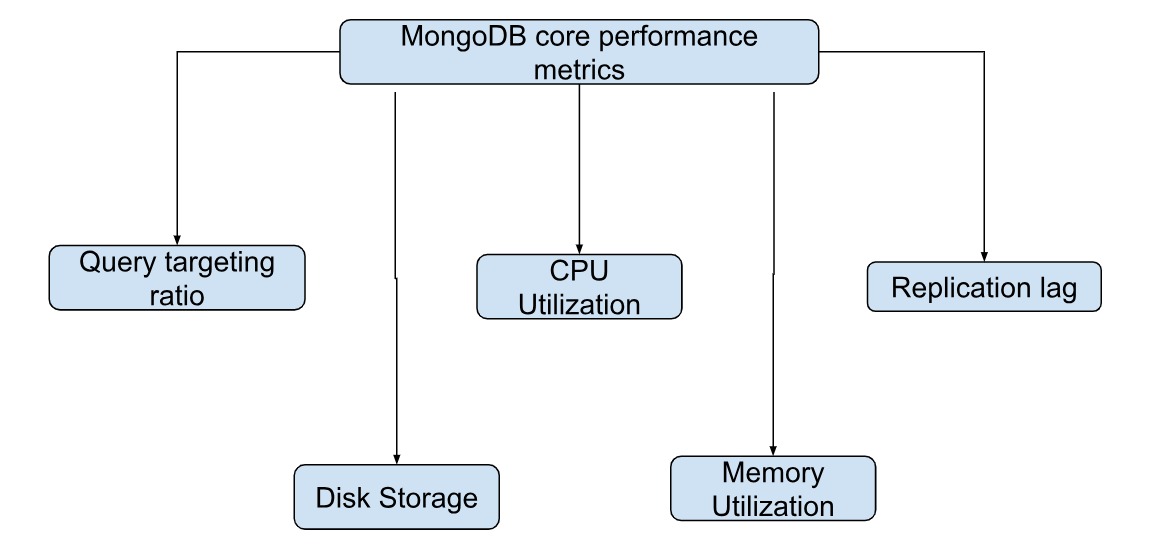
To check if your database is optimized or not, MongoDB provides some core metrics:
- Query targeting
- Storage metrics
- CPU Utilization
- Memory Utilization
- Replication lag
Query targeting
Query targeting is the ratio of the number of documents scanned by the database to the number of documents actually returned by the database query result. The ideal ratio is 1:1, which means that the number of documents scanned are the same as the documents that are returned. A ratio of more than 1 indicates that the query needs to be checked and is not efficient. The greater the ratio, the less efficient the query is.
Storage metrics
Storage metrics measures the disk usage by databases, database collections and indexes. Some key storage metrics are:
- Disk space percent free - indicates how much disk space is left
- Disk IOPS - indicates the number of input and output operations per second
- Disk queue depth - indicates how long the disk queue is, i.e. how many (if any) operations are waiting to be executed
- Disk latency - time (in milliseconds) required to complete a storage operation.
Through these metrics, we can understand where the disk space can be freed up and what processes are no longer active or can be released.
CPU Utilization
These metrics show the CPU usage per deployment, and consist of system CPU and process CPU. These indicate how much CPU time is consumed by system resources (kernel) and user processes (applications). High CPU usage for a longer time can cause operation delays leading to poor performance and inadequate hardware sizing. Through these metrics, we can also know if the indexes are working properly and optimize them, if necessary.
Memory Utilization
Memory utilization is the amount of system memory available for different workloads. Insufficient memory or memory leaks can lead to performance issues or worse - out of memory errors. Some important metrics for memory optimization are:
- System memory - if the system memory is not sufficient, increase the capacity and RAM speed
- Swap usage - When the physical RAM is completely full, the operating system moves less frequently accessed data from RAM to free up memory for an active process. High swap usage indicates that the system does not have sufficient memory, leading to performance issues.
Replication lag
The replication lag indicates the lag or delay between synchronizing primary and secondary. Excessive lags affect the read consistency between the nodes.

Measuring the metrics
Firstly, the values of the above metrics are taken during normal workload conditions. These are called baseline values. Any spikes (deviation) from the baseline values indicate that the values are not in normal range, known as burst values. The metrics values are said to be out of range if the resources are exhausted, query targeting ratio is too high, or there is high replication lag, i.e. the secondary nodes are not in sync with the primary.
Additional metrics
MongoDB offers additional metrics to further investigate performance issues. These are:
- Opcounters
- Network traffic
- Connections
- Tickets available
Opcounters
Opcounters count the number of operations running on a MongoDB process per second since the last restart. These operations include commands, queries, and CRUD operations. Most databases follow a concurrency model to accommodate multiple requests through multiple threads or non-blocking I/O. Using the Opcounter, you can analyze the rate at which different types of operations are performed and find if a particular operation is taking longer than expected.
Network traffic
The network traffic gives information about network performance, including the bytes in, bytes out, number of incoming requests. These represent the average rate at which physical bytes are exchanged between applications and the database per second.
Connections
Connection metric indicates the open number of connections to the database, by applications, shells, or by internal database connections. As the number of connections increases, the load on the database increases, thereby affecting the performance.
Tickets available
This metric displays the number of concurrent read and write operations available to the MongoDB Storage engine. If there are no available tickets for an incoming operation, it needs to wait till the previous operations finish and release a ticket. If there are a lot of waiting operations, it indicates heavy load on the database.
How to view MongoDB metrics using MongoDB Atlas UI
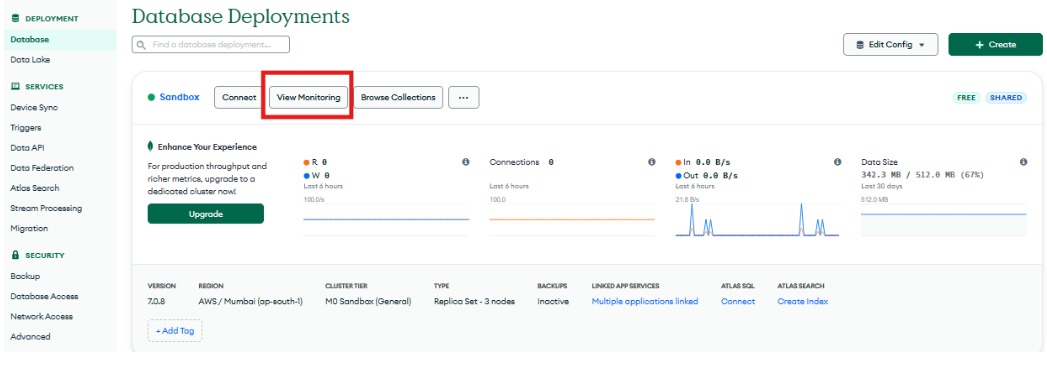
You can register for free on MongoDB Atlas to create your first cluster and work with the metrics. With free cluster, you will be able to access 4 metrics, i.e., Opcounters, connections, network and logical size. To view metrics, go to “View monitoring” on your Atlas database page.

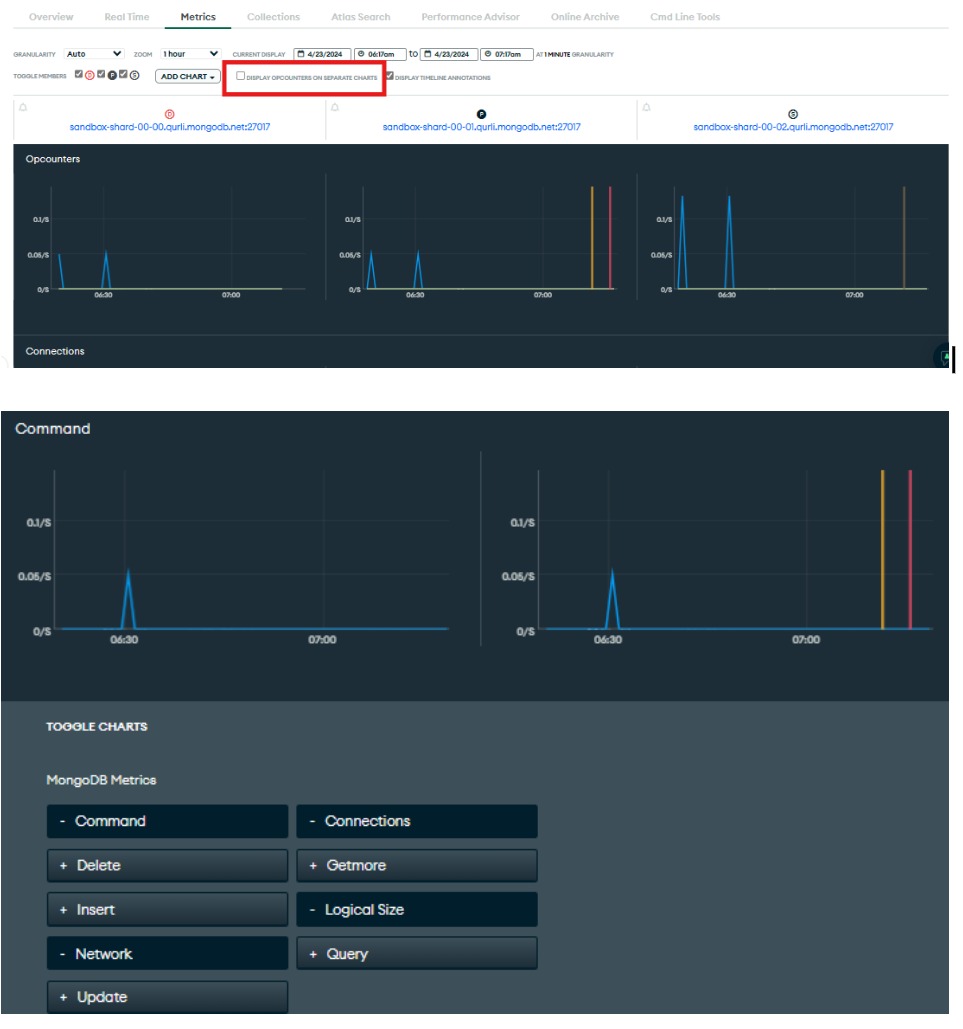
On the metrics tab, you can view all the relevant metric charts. You can get metrics for particular time ranges by customizing the start and end date. You can also fine tune the granularity. By default, the Opcounter chart shows the comprehensive view of all the operations, however if you want to see a separate Opcounter for individual operations, you can select it from the checkbox.

As you can see above, you can see separate metrics for each operation like command, delete, insert, update and so on.
 </p
</p
Notice that the above metrics are only for specific time ranges earlier than the current time. To view real time metrics, you can click on the tab next to the metrics tab - “Real-time”. Real-time and many others (around 40+) metrics are available for M10 and above clusters. You can also configure alerts to indicate performance issues by monitoring the metrics at organizational and project levels (you should be the owner).
You can view/manage the MongoDB metrics through the Atlas CLI (Command line interface) too. For example, to return a list of all the running processes for your project, you can use the command:
atlas processes list
To retrieve connection metrics for a cluster node, use:
atlas metrics processes <cluster _id> -period PID -granularity PT5M -output json -type connection
</cluster>
These are the same options that you see on the Atlas UI metrics page.
Summary
In this article, we have covered some basics of performance metrics. These metrics not only help identify the problematic part of the application, but also provide ways to make the application better. To know more about MongoDB performance and metrics, read the documentation.


.svg)