Introduction
Query store is a new feature, which has introduced in SQL Server 2016.Query store is database level feature. This feature will not enable automatically for databases we have to enable manually. Query store can simplifies the troubleshooting. Because query store automatically captures the Query plans, history of Query and run time statistics for your reference.
Enabling Of Query Store
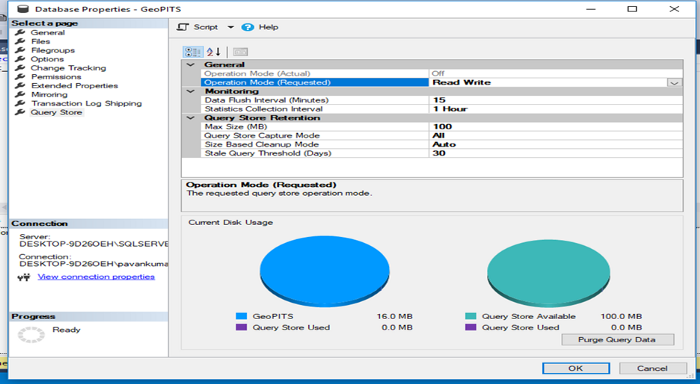
Right click on database ->select properties->select Query store

Data flush interval: query information flushes to disk in particular period of time .default 15 minutes.
Statistics collection interval: this will defines aggregation interval of query runtime statistics that should be used inside the SQL server Query store.
Max size: it defines storage size the Query store
Query store capture mode: every executed Query will be stores in Query store (when select ALL)
Size Based Cleanup mode: it will perform cleanup operation in Query Store.
Stale Query Threshold: it will define how longer the data will stay in the SQL Server Query Store Set values based on requirement and click on OK.
How to verify query store enabled or not:
Go To SQL Server Management Studio
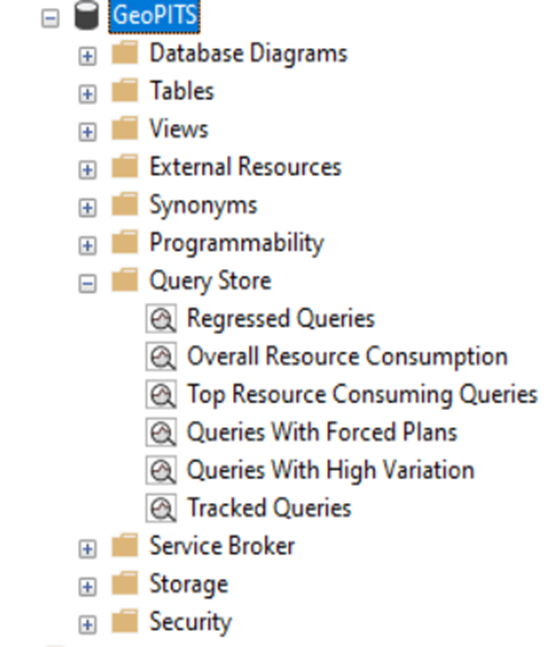
Expand database you can see the Query store option.
If you Expand Query Store you can see different option under Query store, which will be useful to monitor performance of Queries

When you expand query store you can see below sections
Regressed Queries
Overall Resource consumption
Top Resource consuming Queries
Queries with Forced Plans
Queries with high variation
Tracked Queries
Regressed Queries:
Regressed Queries will give information about the query’s which are executing currently and it’s execution plan details and which are using the worse execution plans.
By using Regressed Queries you can observe performance problems with actual queries that need to be fix or improve.
Overall Resource consumption:
It will give information about total resources used by the database in particular time of intervals.
Top Resource consuming Queries:
This will gives information about the queries, which are used the more more resources. You can monitor resource consumption of particular Query under this section.
Queries with Forced Plans:
This will stores the lists previously forced plans using Query Store. And quickly access all currently forced plans
Queries with high variation:
using this we can analyze queries with high execution variations as it relates to any of the available dimensions such as Duration, CPU time, I/O and Memory usage in the desired time intervals.
Tracked Queries:
This will use to track the executions of the most important Queries in real time. You can use this view when you have Queries with forced plans and you want to make sure that query performance is stable.
Advantages of Query Store:
Query store can automatically starts picking information and execution plans that are used in the query runtime for a better troubleshooting.
major benefit of using is that since it stores the captured information in its internal tables, the information retrieves even when the server is restarted.
Query store feature helps understanding the type of workload the clients or users are using by capturing the query text and the execution plan
Another benefit of this query store is that it can be enabled for particular databases where you want troubleshooting and not the entire server.
Limitations:
Cannot enable for master and tempdb databases
Lack of control(multiple DBAs can change settings)
Not applicable for read only databases including Always on read only databases
When query store reaches Capacity(max size) it will become read only mode
Common scenarios where the SQL server Query store feature can be useful:
Find most expensive queries for CPU, I/O and Memory.
Find frequently failing Queries.
Identify queries that have many execution plans
Find slowed queries
Get full history of Query Executions
Get information about query regressions (a new execution plan generated by Query engine is worse than older one).quickly find performance regressions and fixing it by forcing the previous query plan whose performance are much better than a newly generated plan.
Determine how many times a query was executed in the given range of time.


.svg)